|
ALL TRAVEL LIFE CULTURE STYLE TECH Türkçe |
Basic Indicators Used in Technical AnalysisWe have compiled the important indicators used in technical analysis in financial markets.
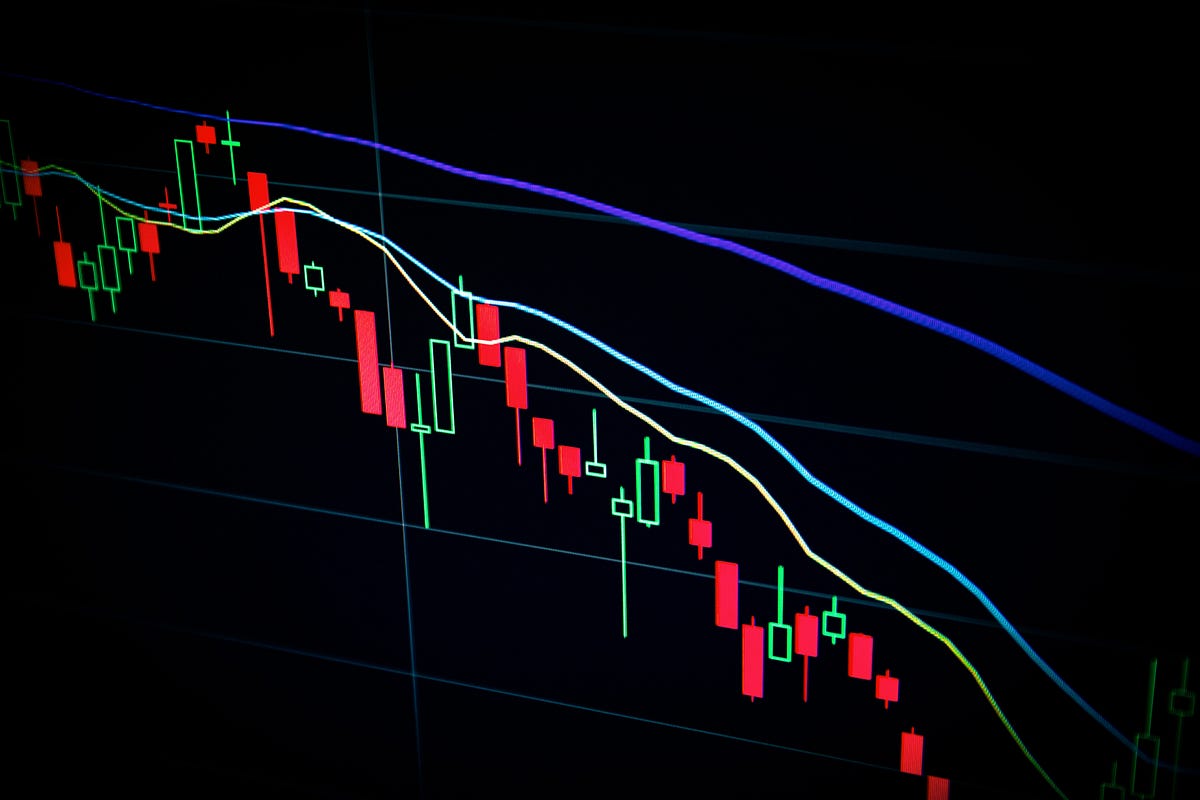
Technical analysis is a method used by investors and traders to understand market movements and predict future price movements. Various indicators play an important role in this analysis process. We will explain five important indicators that investors often use - Moving Average, MACD (Moving Average Convergence Divergence), RSI (Relative Strength Index), Williams %R and Bollinger Bands. 1. Moving Averages Moving Averages help determine price trends by averaging the closing prices over a certain period of time. There are two main types: Simple Moving Average (SMA): It is the arithmetic average of the closing prices over a certain period. Exponential Moving Average (EMA): It is calculated by giving more weight to more recent price movements, so it reacts faster. Usage: Moving averages are used to determine the direction of the trend. For example, if the 50-day moving average crosses the 200-day moving average above, this is known as a ?golden cross? and may indicate the beginning of an uptrend. 2. MACD (Moving Average Convergence Divergence) MACD is a momentum indicator that shows the relationship between two moving averages. Calculation: The MACD line is the difference between the 12-period EMA and the 26-period EMA. The signal line is the 9-period EMA of the MACD line. In addition, the MACD histogram visualizes the difference between these two lines. Usage: MACD is used to determine trend strength, directional changes, momentum, and possible reversal points. If the MACD line crosses the signal line upwards, it gives a buy signal, and if it crosses downwards, it gives a sell signal.  3. RSI (Relative Strength Index)
RSI is a momentum oscillator used to determine whether an asset is overbought or oversold. Calculation: It is usually calculated over a 14-day period. It is determined by the ratio between increases and decreases. Usage: If the RSI value is above 70, the asset is considered overbought, and if it is below 30, it is considered oversold. These levels are warnings that the price may reverse. However, values ??outside these levels can also be normal in strong trends. 4. Williams %R Williams %R is a momentum indicator and measures the position of the price within the range of the highest and lowest price levels of the closing level in a given period. Calculation: A 14-day period is usually used. Formula: %R = (Highest Price - Closing Price) / (Highest Price - Lowest Price) * -100 Usage: If it is above -20, it is interpreted as overbought, if it is below -80, it is interpreted as oversold. This indicator, like the RSI, shows that the market has reached extremes and gives reversal signals. 5. Bollinger Bands Bollinger Bands are an indicator used to measure volatility. Calculation: The 20-day SMA is usually used as an average. The upper band is calculated by adding 2 standard deviations above this average, and the lower band is calculated by adding 2 standard deviations below the average. Usage: The narrowing of the bands usually indicates low volatility and a possible big price movement. The widening of the bands is an indicator of high volatility. When the price touches one of the bands or goes outside the bands, it usually indicates that the market is in the overbought or oversold area. These indicators form the cornerstones of technical analysis and each sheds light on different aspects of the market. However, no indicator is perfect on its own and therefore more reliable analyses are usually made by using several indicators together. Investors should choose indicators that suit their own strategies and always consider other economic and political factors when making decisions based on these indicators. Source: Grok
|
Tweets by Kayip_Esya |


Lost Something | Found Something | Lost Items List | Unattended Items List Search Lost Item | Blog | Contact |

